Ever wondered if that chilled, refreshing can of Brisk Tea is doing your body any favors? This popular ready-to-drink beverage, backed by the Pepsi-Lipton partnership, fills store shelves nationwide. But what’s really inside that vibrant packaging?
While it delivers a quick caffeine boost and sweet flavor, not all ingredients align with wellness goals. Some varieties pack added sugars, artificial flavors, or preservatives—factors worth considering before your next sip.
This guide breaks down the nutritional pros and cons, helping you decide if it fits your lifestyle. From caffeine content to sugar alternatives, we’ll explore what makes this drink a hit—and when moderation matters most.
Key Takeaways
- Brisk Tea offers convenience but varies in nutritional value by flavor.
- Sugar content differs significantly between sweetened and unsweetened options.
- Artificial ingredients may affect long-term health if consumed excessively.
- Caffeine levels provide energy but could disrupt sleep patterns.
- Moderation helps balance enjoyment and health-conscious choices.
Understanding Brisk Iced Tea’s Popularity
Few beverages capture America’s love for convenience like Brisk Iced Tea. Its bold flavors and grab-and-go cans make it a staple in coolers and vending machines nationwide. But its rise to fame wasn’t accidental—it stemmed from a powerhouse partnership.
The Pepsi-Lipton Collaboration Story
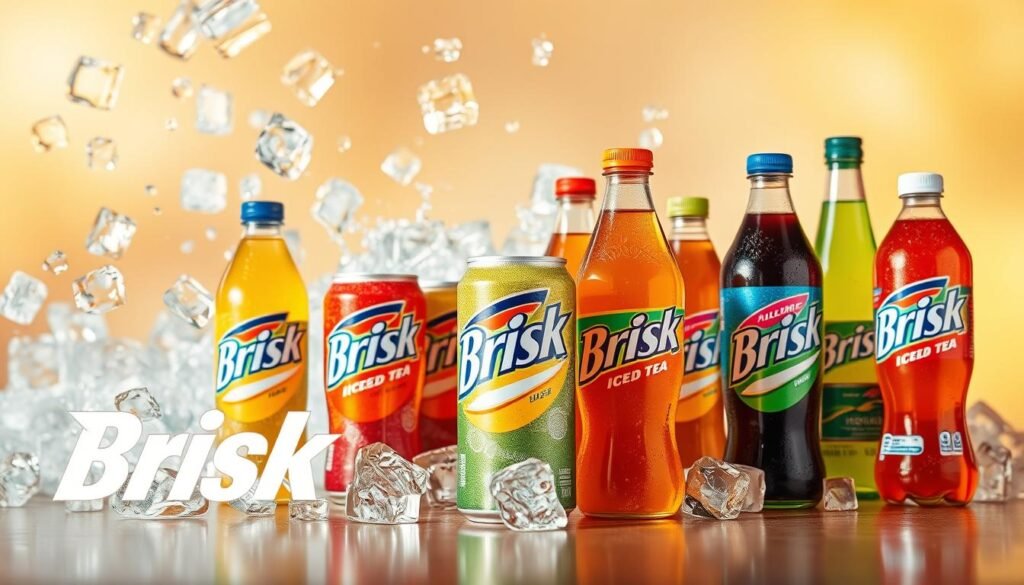
In 1991, PepsiCo and Unilever’s Lipton joined forces to revolutionize ready-to-drink tea. Their goal? To create a beverage with mass appeal. The result was Brisk—a brand that blended Lipton’s tea expertise with Pepsi’s distribution muscle.
By 1992, iced tea consumption hit seven gallons per person annually. Brisk’s launch capitalized on this trend, offering a sweeter, bolder alternative to traditional brews.
Market Position Among Competitors
Brisk carved its niche with edgy marketing—think graffiti-style ads and celebrity endorsements. It targeted younger drinkers craving both flavor and attitude. Today, it battles giants like Arizona and Nestea for shelf space.
| Brand | Market Share | Key Strength |
|---|---|---|
| Brisk | 22% | Flavor variety, fountain availability |
| Arizona | 34% | Value pricing |
| Nestea | 18% | Global recognition |
Fast-food chains further boosted Brisk’s reach. Many fountain dispensers feature it alongside sodas, reinforcing its status as a go-to refreshment.
Is Brisk Iced Tea Healthy? A Nutritional Breakdown
A 12-ounce serving of Brisk Iced Tea offers convenience, but how does it stack up nutritionally? While its crisp taste appeals to many, the drink’s health impact depends on what’s inside the can.
Calorie Content per Serving Size
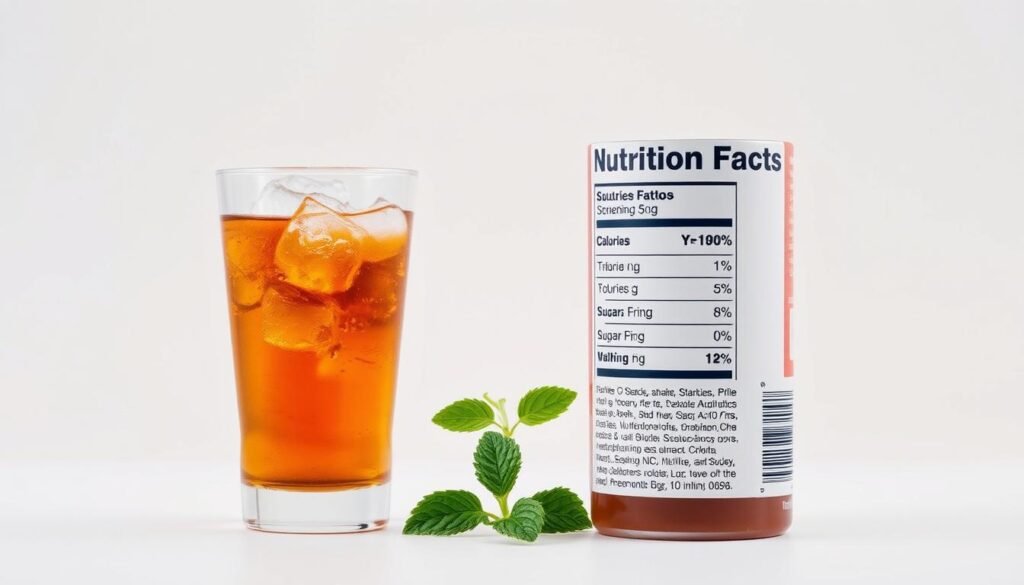
Each 12-ounce can contains 60 calories, primarily from carbohydrates. For comparison, homemade unsweetened iced tea typically has fewer than 5 calories per cup. The difference? Store-bought versions often pack added sweeteners.
Macronutrient Profile Overview
Brisk’s tea contains 17g of carbs—all from sugar. Unlike snacks with protein or fat, this drink provides quick energy without lasting fullness. Here’s how it compares to a DIY alternative:
| Nutrient | Brisk (12oz) | Homemade (12oz) |
|---|---|---|
| Calories | 60 | |
| Sugar | 17g | 0g (unsweetened) |
| Protein/Fat | 0g | 0g |
Many consumers drink larger portions, doubling or tripling their intake. This turns a modest snack into a significant source of empty calories—energy without vitamins or fiber.
Sugar Content in Brisk Tea and Health Implications
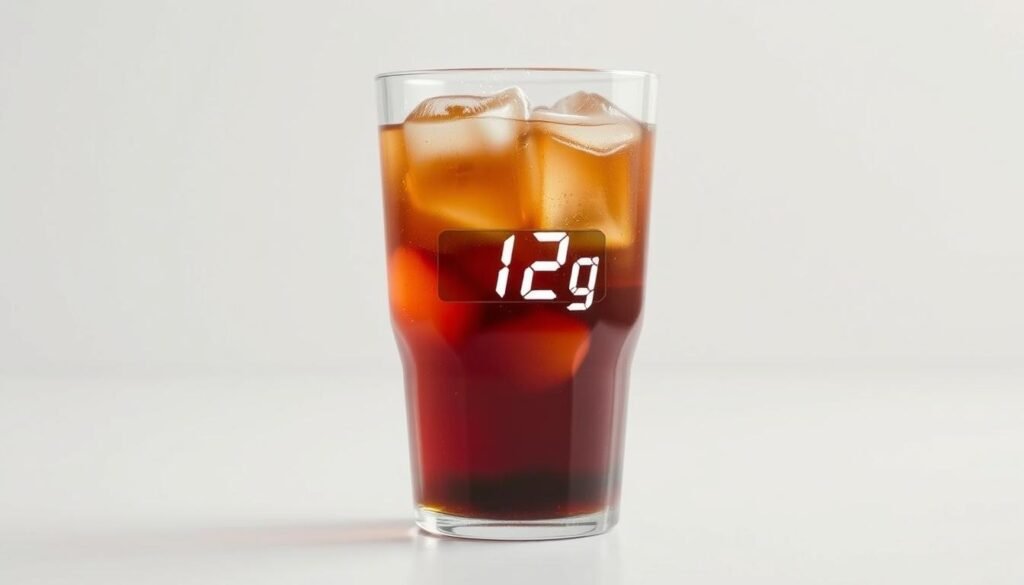
That sweet kick in every sip of Brisk comes with a hidden cost—sugar overload. A single 12-ounce serving contains 31g sugar, equal to 7.5 teaspoons. That’s more than the American Heart Association’s daily limit for women (25g) and close to the men’s cap (36g).
How Much Sugar Is Too Much?
To put it in perspective, one can of Brisk Lemon has nearly the same grams sugar as a 12-oz soda. Here’s how they stack up:
| Beverage | Sugar per 12oz |
|---|---|
| Brisk Lemon Iced Tea | 31g |
| Cola | 39g |
| Homemade Unsweetened Tea | 0g |
Metabolic and Dental Risks
Regularly consuming high sugar content drinks strains the pancreas, triggering insulin spikes. A BMJ study found that just one sugary beverage daily increases diabetes risk by 18%.
The ADA also warns that sugar fuels cavity-causing bacteria. Combined with tea’s acidity, it can erode enamel over time.
“Liquid sugar bypasses the body’s normal satiety signals, leading to overconsumption and weight gain.”
For those monitoring health, opting for unsweetened varieties or smaller portions helps balance enjoyment and wellness.
Artificial Ingredients and Preservatives Analysis
Behind the bold taste of Brisk Iced Tea lies a mix of additives designed to preserve freshness and enhance flavor. While these ingredients keep the drinks shelf-stable, some raise questions about long-term health effects.
Preservatives Under the Microscope
Brisk relies on potassium sorbate and sodium benzoate to prevent spoilage. These common food preservatives inhibit mold and bacteria growth. However, when combined with ascorbic acid (vitamin C), sodium benzoate can form benzene—a potential carcinogen.
The FDA regulates benzene levels, but frequent consumption may still pose risks. Opting for fresher alternatives reduces exposure to these chemical reactions.
Phosphoric Acid’s Hidden Impact
Found in many sodas and teas, phosphoric acid adds tanginess but may interfere with mineral absorption. Studies suggest it could weaken bones over time by leaching calcium.
“Regular intake of phosphoric acid-containing beverages correlates with lower bone mineral density in adolescents.”
Artificial Colors and ADHD Links
Vibrant hues in Brisk come from dyes like Red 40 and Yellow 5. These synthetic colorings, approved by the FDA, face scrutiny for potential hyperactivity effects in children. The European Union requires warning labels on products containing these additives.
- Red 40: Derived from petroleum, linked to allergic reactions
- Yellow 5: May worsen asthma symptoms in sensitive individuals
For those concerned about additives, homemade iced tea offers a cleaner alternative without artificial enhancers.
The “Natural Flavors” Mystery
Brisk labels often list “natural flavors” without specifics. This broad term can include plant or animal-derived compounds processed in labs. While generally recognized as safe, their exact composition remains undisclosed.
Organic tea brands typically skip these ambiguous ingredients, relying instead on real tea leaves and fruit extracts for taste.
Caffeine Levels Across Brisk Varieties
Not all Brisk flavors pack the same caffeine punch—some might surprise you. While a standard 12-ounce drink averages 9–11mg, certain options exceed or fall short. Here’s what’s inside those vibrant cans.
Milligrams per Flavor: Lemon vs. Peach
Lemon Brisk leads with 11mg per serving, while peach contains slightly less at 9mg. Other flavors like raspberry or blueberry hover near 10mg. For context:
| Beverage | Caffeine (12oz) |
|---|---|
| Brisk Lemon | 11mg |
| Brisk Peach | 9mg |
| Black Coffee | 95mg |
| Cola | 34mg |
Note: Homemade tea contains around 20–60mg per cup, depending on brew strength.
Impact on Sensitive Populations
Pediatricians advise limiting kids to 45mg daily—about four Brisk servings. Pregnant individuals should cap at 200mg (18 cans). Excess caffeine may cause:
- Jitters or sleep disruptions
- Increased heart rate in sensitive adults
- Dehydration due to mild diuretic effects
How It Stacks Up Against Competitors
Brisk’s caffeine content trails Lipton (15mg) but matches Pure Leaf. Unlike coffee, its lower dose reduces crash risks but still adds up with multiple servings.
“Caffeine sensitivity varies—monitor personal tolerance, especially with flavored teas.”
Nutritional Benefits of Tea Compounds
Black tea’s natural compounds offer more than just flavor—they pack potential wellness perks. Polyphenols like thearubigins and theaflavins act as antioxidants, which may combat oxidative stress in the body.
Antioxidant Power in Every Sip
Processing affects antioxidant levels. Ready-to-drink versions like Brisk retain some polyphenols but lose up to 40% compared to fresh-brewed tea. A study linked daily black tea consumption to a 9–13% lower risk of mortality, especially from heart disease.
Flavonoids and Heart Health
These plant compounds improve blood vessel function. Research shows they may reduce stroke risk, even when milk or sugar are added. For more, see this analysis on tea and cardiovascular health.
- Thearubigins: Give black tea its dark color and may lower inflammation.
- Bioavailability: Fresh brewing releases more flavonoids than canned options.
“Regular tea drinkers show better arterial flexibility, a key marker for heart health.”
Green and white teas offer higher antioxidant levels, but black tea’s unique compounds still deliver benefits over time.
Brisk Tea vs. Homemade Iced Tea
Your iced tea choice impacts sugar intake, antioxidants, and even your wallet. While store-bought versions offer grab-and-go ease, brewing your own creates a cleaner, customizable option. Let’s examine the key differences.
Freshness and Processing Differences
Mass-produced tea undergoes pasteurization, reducing polyphenol levels by 30-40%. Homemade versions retain more antioxidants since you control steeping time and temperature. A fresh-brewed cup delivers:
- Higher levels of heart-healthy flavonoids
- Zero preservatives or artificial colors
- Adjustable strength based on preference
Additive-Free Alternative Benefits
Ditching pre-made versions eliminates exposure to phosphoric acid and sodium benzoate. A study showed DIY drinkers consume 92% less synthetic additives annually. Bonus? You avoid BPA from plastic bottles used in some commercial products.
“Switching to homemade iced tea could save the average American 25 pounds of sugar per year.”
Cost and Convenience Factors
While Brisk costs about $0.50 per serving, homemade averages $0.15—saving $127 yearly for daily drinkers. The trade-off? 10 minutes of brewing versus instant availability.
| Factor | Store-Bought | Homemade |
|---|---|---|
| Time | Instant | 10 min prep |
| Cost per serving | $0.50 | $0.15 |
| Customization | Limited flavors | Endless variety |
Try this simple recipe: Steep 4 bags of black tea in 4 cups hot water for 5 minutes. Remove bags, add 4 cups cold water, and refrigerate. Infuse with lemon slices or mint for extra zest.
Diet and Zero-Sugar Options Examined
Diet versions of popular drinks promise sweetness without the calories—but at what cost? Brisk’s zero-sugar varieties swap cane sugar for artificial sweeteners, appealing to calorie-counters. Yet, the trade-offs in taste and potential health effects deserve a closer look.
Sweeteners Behind the Sugar-Free Label
Brisk’s diet lineup relies on sucralose and acesulfame potassium (Ace-K). These lab-made compounds are 200–600 times sweeter than sugar, allowing minimal use per can. Here’s how they compare to natural alternatives:
| Sweetener | Calories | Aftertaste | Gut Impact |
|---|---|---|---|
| Sucralose | 0 | Mild metallic | May alter microbiome |
| Ace-K | 0 | Slightly bitter | Limited research |
| Stevia | 0 | Licorice-like | Generally safe |
A 2021 Gut Microbes study noted sucralose could reduce beneficial gut bacteria by 50% in high doses. While occasional sips pose little risk, daily drinkers might consider rotating sweeteners.
Taste Test: Diet vs. Original
Blind taste panels reveal stark differences. Regular Brisk Lemon scored higher for flavor depth, while diet versions faced criticism for:
- Chemical aftertaste: 68% detected artificial notes.
- Thinner mouthfeel: Lack of sugar reduced body.
- Sweetness overload: Some found it cloying versus balanced.
“Non-nutritive sweeteners trick the brain’s reward system, often leaving drinkers unsatisfied and craving more.”
For those prioritizing health, unsweetened sparkling teas or homemade brews with fruit infusions offer middle-ground varieties without synthetic additives.
Dental Health Considerations
Your favorite fizzy drink might be hiding a threat to your pearly whites. Many bottled drinks combine two enamel-damaging factors: high acidity and added sweeteners. Let’s examine how these affect oral health long-term.
When Refreshment Wears Down Enamel
With a pH of 3.1—similar to soda—Brisk creates an acidic environment in your mouth. This weakens tooth enamel through demineralization, especially with frequent sipping. Here’s how common beverages compare:
| Beverage | pH Level | Enamel Risk |
|---|---|---|
| Brisk Iced Tea | 3.1 | High |
| Milk | 6.7 | Low |
| Tap Water | 7.0 | None |
Sugar’s Double Threat
The 31g of sugar per serving feeds cavity-causing bacteria like Streptococcus mutans. These microbes produce acid as they metabolize sugar, compounding the acidity problem. Darker flavors may also stain teeth due to caramel coloring.
Prevention strategies include:
- Using a straw to bypass teeth
- Rinsing with water after drinking
- Waiting 30 minutes before brushing
“Frequent acidic beverage consumption can erode enamel irreversibly within months.”
For those who enjoy these bottle drinks occasionally, pairing them with cheese or nuts can help neutralize acids naturally.
Impact on Hydration Levels
Staying hydrated isn’t just about what you drink—it’s about what your body keeps. While Brisk Tea might seem refreshing, its ingredients can subtly undermine hydration goals.
Caffeine’s Hidden Trade-Off
Each 12-ounce can contains 9–11mg caffeine, a mild diuretic. Research shows caffeine increases urine output by up to 30% within 3 hours. For comparison:
| Beverage | Hydration Index* |
|---|---|
| Water | 1.0 |
| Brisk Tea | 0.8 |
| Electrolyte Drink | 1.2 |
*Higher numbers indicate better fluid retention.
The Sugar-Sodium Paradox
Sweetened varieties pack 31g sugar and 190mg phosphorus per serving. Sugar slows water absorption, while phosphorus may disrupt electrolyte balance. Sodium (15mg per can) helps retain fluids but can’t offset the diuretic effect.
“High-sugar drinks create a hydration illusion—they satisfy thirst briefly but increase net fluid loss.”
In hot weather, this combo raises risks. A 2022 study found sugary drink consumers needed 20% more time to rehydrate post-exercise versus water drinkers.
- Better choices: Unsweetened tea or water with lemon
- Timing tip: Pair caffeinated drinks with extra water
Blood Sugar and Insulin Response
That refreshing sip of sweetened tea does more than quench thirst—it sends your blood sugar on a rollercoaster. With high fructose corn syrup as a primary sweetener, each serving triggers rapid glucose spikes followed by crashes that leave you craving more.
How Sweeteners Affect Metabolism
High fructose corn syrup metabolizes differently than table sugar. While both contain fructose and glucose, HFCS delivers them more rapidly to the bloodstream. This overwhelms the liver, increasing fat storage risks.
Compare glycemic responses:
| Sweetener | Glycemic Index | Insulin Spike |
|---|---|---|
| HFCS | 68 | High |
| Table Sugar | 65 | Moderate |
| Stevia | 0 | Minimal |
Special Considerations for Diabetics
The American Diabetes Association warns against sugary drinks due to their health risks. A single 12-oz can with 17g sugar could exceed a diabetic’s carb limit for snacks.
Key concerns include:
- Dawn phenomenon: Morning blood sugar spikes worsen with evening consumption
- Insulin resistance: Regular intake may reduce cell sensitivity
- Weight gain: Liquid calories don’t trigger fullness signals
“Sugar-sweetened beverages increase type 2 diabetes risk by 26%, regardless of body weight.”
Many diabetics report switching to unsweetened varieties or infusing water with berries for flavor without the glucose surge.
Weight Management Factors
Liquid calories play a sneaky role in weight gain, often slipping under your satiety radar. While that 60-calorie serving might seem harmless, these drinks add up quickly without making you feel full. Understanding this dynamic helps explain why portion size matters more than many realize.
Liquid Calories and Satiety Signals
Your body processes beverages differently than solid foods. Research shows liquid calories bypass normal fullness mechanisms, leading to overconsumption. A single 12-oz can contains:
- 17g sugar (empty calories providing energy without nutrients)
- No protein or fiber to slow digestion
- Quick absorption that spikes blood sugar
Compared to whole fruit, which contains fiber and water, sweetened drinks offer minimal satisfaction. The WHO recommends limiting added sugars to 25g daily—just one can uses 68% of this allowance.
Obesity Research Findings
Studies reveal troubling connections between sugary drinks and weight gain. A 10-year trial found adults consuming 1-2 servings daily had:
| Outcome | Increase vs Non-Drinkers |
|---|---|
| Waist circumference | 27% greater |
| Obesity risk | 33% higher |
| Visceral fat | 42% more |
“Each daily sugary drink increases a child’s obesity odds by 60%, independent of other diet or activity factors.”
Habitual drinkers often underestimate cumulative impact. Switching to unsweetened versions or smaller portions supports better health outcomes over time.
Flavor Variety and Ingredient Differences
The rainbow of Brisk options goes beyond basic lemon—each flavor tells a different nutritional story. While all share black tea as a base, their sugar content, caffeine levels, and additives vary widely. Let’s unpack what makes these varieties distinct.
Blueberry Pomegranate Breakdown
This purple-hued favorite contains 9mg caffeine per 12oz—less than lemon but more than herbal varieties. Its sweetness comes from high fructose corn syrup, totaling 28g sugar. The “natural flavors” label hints at berry extracts, while Red 40 and Blue 1 create its vibrant color.
Blood Orange vs Tropical Mango
Blood Orange’s freeze-form version has just 5mg caffeine, making it a lighter option. Both flavors use similar sweeteners but differ in:
- Colorants: Blood Orange relies on Yellow 6, Tropical Mango uses Yellow 5
- Acidity: Citric acid levels are higher in the citrus option
- Availability: Mango dominates Southern states, Orange leads in Northeast
| Flavor | Caffeine | Sugar | Top Market |
|---|---|---|---|
| Blueberry Pomegranate | 9mg | 28g | Midwest |
| Blood Orange | 5mg | 25g | Northeast |
| Tropical Mango | 8mg | 26g | South |
Consumer polls show Lemon remains the top seller at 42%, but newer flavors like Peach (23%) gain ground yearly. Those avoiding artificial dyes often choose unsweetened versions, despite their limited variety.
Consumer Alternatives to Brisk
Craving a refreshing drink but want to skip the sugar rush? Numerous options exist that deliver flavor without excessive sweeteners. Whether store-bought or homemade, these alternatives offer better control over what you consume.
Lower-Sugar Commercial Choices
Many brands now offer lightly sweetened or unsweetened varieties. Honest Tea balances flavor with just 17mg caffeine per bottle, while Gold Peak Unsweetened packs bolder taste at 48mg. Consider these comparisons:
| Brand | Sugar (12oz) | Caffeine | Price |
|---|---|---|---|
| Honest Tea | 3g | 17mg | $1.79 |
| Gold Peak Unsweetened | 0g | 48mg | $1.49 |
| Pure Leaf Unsweetened | 0g | 42mg | $1.89 |
For those avoiding artificial sweeteners, look for drinks using stevia or monk fruit. These provide sweetness without spiking blood sugar.
Crafting Your Own Healthy Brew
Homemade iced tea lets you control every ingredient. Cold brewing preserves antioxidants while reducing bitterness. Try this simple method:
- Add 8 tea bags to 1 quart cold water
- Refrigerate for 6-12 hours
- Remove bags and sweeten lightly if desired
- Serve over ice with fresh fruit
This option costs pennies per serving and eliminates preservatives. Experiment with herbal blends or green tea for variety.
Whether choosing store-bought or DIY, these options help maintain refreshment without compromising wellness goals.
Moderation Guidelines for Regular Drinkers
Enjoying your favorite beverage doesn’t mean sacrificing health goals. With mindful habits, you can savor the flavor while keeping sugar intake in check. The American Heart Association suggests men limit added sugars to 36g daily, while women should aim for ≤25g—one serving of sweetened Brisk covers 86% of that.
Weekly Limits and Smart Swaps
Treat sweetened drinks as occasional indulgences, not daily staples. Here’s a flexible framework:
| Frequency | Strategy |
|---|---|
| Daily | Switch to unsweetened or diet versions |
| 3x/week | Dilute with sparkling water (50/50) |
| Special occasions | Stick to one 12-oz can |
Practical Reduction Tips
Small changes add up over time. Try these steps:
- Gradual cuts: Reduce portion sizes by 25% weekly.
- Flavor boosts: Add fresh citrus or mint to unsweetened tea.
- Habit stacking: Pair drinks with a healthy snack to curb cravings.
“Liquid sugar reduction strategies improve metabolic markers within 8 weeks.”
Avoid stocking multiple cans at home. Instead, keep reusable bottles with infused water handy. For caffeine lovers, alternating with herbal blends helps taper intake without withdrawal.
Conclusion: Making Informed Tea Choices
Balancing enjoyment and wellness starts with smart beverage choices. While brisk iced tea offers convenience, occasional consumption works best. Watch for added sugars and artificial ingredients that may impact long-term health.
Homemade brews provide control over ingredients. Steep fresh leaves with fruit infusions for natural flavor. Nutritionists recommend limiting pre-made versions to special treats.
Final checklist:
- Check labels for sugar content
- Opt for unsweetened or diet versions
- Experiment with DIY recipes
Small changes lead to better hydration and fewer empty calories. Choose wisely, sip mindfully.
